
Investigation of NFKB1 Gene Expression and rs28362491 Polymorphism in Relation to Diabetic Nephropathy and Glycemic Dysregulation in Iraqi T2DM Patients
Abstract
Background: Diabetic nephropathy is a microvascular complication that can occur in people type 2 diabetes nephropathy (T2DN). The aim of the study:To investigate the correlation between NFKB1 gene expression and NFKB1 (rs28362491) SNP with glycemic profile in Iraqi patients with diabetic nephropathy (T2DN). Materials and methods: For this study, 150 volunteers were split into three groups: 50 in the control group, 50 in the T2DM group, and 50 in the T2DN group. According to the kit's instructions, spectrophotometric analysis was used to determine the HbA1c (%) and FBG (mg/dl), blood urea (UR) and creatinine (CR) (mg/dl) parameters. The ELIAS kit was used to determine the fasting insulin (µu/ml). RT-qPCR was used for estimation of NFKB1 gene expression. Using specific primer sequences and the polymerase chain reaction method known as restriction fragment length polymorphism (PCR-RFLP), the NFKB1 (rs28362491) SNP was evaluated. Results: When compared to controls, the T2DM and T2DN groups' HbA1c%, FBG (mg/dl), INS (µu/ml), and HOMA-IR% indices of glycemic control were significantly higher (P-value<0.05), highest insulin levels, blood urea, and serum creatinine levels (P-value<0.05). For NFKB1 (rs28362491) SNP, the I/I genotype was present in 11.0% of the Control group, 21.3% of the T2DM group, and 25.8% of the T2DNP group. The p-value for this genotype was <0.001, indicating significant differences in its distribution across the groups. The results of this study revealed that there is a significant difference (P<0.001) in AFC (Average Fold Change) of NFKB1 gene expression were (1.0197±0.7), (4.448±1.08), and (8.704±2.14) in control, T2DM, and T2DN, respectively. Conclusion: Differed expression of NFKB1 between the control group and T2DN patients indicates functional involvement of NF-κB signaling in the development of DN. These results suggest that the regulatory role of NFKB1 expression and the associated effect on inflammation and renal function of T2DM need to be proven with further studies. Although this gene might serve as a potential biomarker prospect in the future, larger-scale studies are necessary for the verification of predictive susceptibility or guiding therapeutic treatments
Introduction. A common and dangerous side effect of diabetes mellitus is diabetic nephropathy (DN), which is characterized by increasing kidney deterioration that eventually results in end-stage renal disease (ESRD) [1]. Persistent urinary protein (albumin excretion rate (AER) > 300 mg/24 h) in diabetic patients without other renal disease and urinary tract infection is defined as DN [2]. Hyperglycemia is the main cause of kidney damage in the complex pathophysiology of diabetic kidney disease. Therefore, it is still essential to comprehend the underlying biological pathways in order to create effective therapies, especially the impact of inflammation and hereditary variables [3]. Nuclear factor kappa-light-chain-enhancer of activated B cells (NF-κB) is a transcription factor that plays a pivotal role in regulating the immune response and inflammation. The NFKB1 gene encodes the p50 subunit of NF-κB, which is integral to the formation of the active NF-κB heterodimer. In the context of DN, the activation of NF-κB leads to the expression of pro-inflammatory cytokines, chemokines, and adhesion molecules, contributing to renal inflammation and fibrosis [4].
In order to identify short-term diabetes complications (diabetic ketoacidosis and hyperglycemic hyperosmolar state), intermediate-term diabetes complications (infections), and immediate complications of glucose-lowering medications (hypoglycemia), glucose control is essential [5]. Insights into unique glucose patterns are also provided by glucose monitoring, enabling customized patient care [6]. Additionally, the kidneys are in charge of insulin metabolism and the excretion of numerous drugs that lower blood sugar. With a tendency for both hyperglycemia from decreased excretion and consumption and fasting hypoglycemia from decreased capacity for gluconeogenesis and extended half-life of glucose-lowering medications, the overall impact of this interaction between the kidneys, glucose metabolism, and medication clearance can vary greatly amongst individual patients [7, 8].
Recent studies have demonstrated that elevated levels of glucose can activate the NF-κB signaling pathway, promoting an inflammatory state within renal tissues. For instance, hyperglycemia-induced oxidative stress has been shown to enhance NFKB1 expression, further perpetuating inflammatory responses and accelerating nephron damage [9]. Furthermore, polymorphisms in the NFKB1 gene have been associated with susceptibility to DN, suggesting a genetic predisposition that may exacerbate the renal complications in diabetic patients [10]. Effective glycemic control is critical in mitigating the risk of DN. Studies have shown that maintaining optimal blood glucose levels can significantly reduce the incidence and progression of nephropathy among diabetic patients. A study demonstrated that every 1% reduction in HbA1c levels corresponds to a 37% reduction in the risk of microvascular complications, including nephropathy [11].
Moreover, continuous glucose monitoring and newer therapeutic modalities such as sodium-glucose cotransporter 2 (SGLT2) inhibitors have emerged as promising strategies. SGLT2 inhibitors not only improve glycemic control but also exert direct renal protective effects by reducing hyperfiltration and promoting natriuresis [12]. Recent evidence suggests that these agents may modulate inflammatory pathways, including NF-κB, thereby further protecting against DN progression [13]. The understanding of DN has evolved significantly, with ongoing research focusing on molecular targets and novel therapeutic approaches. The development of agents that specifically inhibit NF-κB signaling could potentially provide a dual benefit: controlling inflammation and protecting renal function. Additionally, therapies aimed at enhancing the gut microbiomes and modulating systemic inflammation are being explored as adjunctive treatments for diabetic patients at risk of nephropathy [14].
Furthermore, gene therapy approaches targeting NFKB1 expression are being investigated, which may offer a future avenue for personalized medicine in DN management. Given the strong association between genetic predisposition, inflammation, and glycemic control, a multidimensional approach that encompasses pharmacological, lifestyle, and genetic factors will likely yield the most effective outcomes in combating diabetic nephropathy [15]. The NFKB1 gene plays a crucial role in mediating renal inflammation, while glycemic management remains the cornerstone of DN prevention and treatment [16].
The aim of the study. The aim of this research to investigation of the correlation between NFKB1 gene expression and glycemic profile in Iraqi patients with diabetic nephropathy (T2DN).
Materials and methods
Study design
One hundred and fifty participants were divided up into three groups for this study, Control group (N=50), T2DM group (N=50), and T2DN group (N=50). All subjects had blood drawn for molecular and biochemical examinations. With mean ages of 50.56±8.14 years for the Control group, 54.8±10.63 years for the T2DM group, and 52.86±11.07 years for the T2DNP group, the participants' ages ranged from 25 to 70 years. 50 patients with type 2 diabetes (T2DM), 50 patients with diabetic nephropathy (T2DN), and 50 participants in good health were included in this cross-sectional investigation.
The rs28362491 polymorphism in the NFKB1 gene was selected for its known functional significance and its association with inflammatory and immune-related diseases. This promoter polymorphism, which is a 4 bp ATTG indel, has been demonstrated to affect NFKB1 gene transcriptional activity leading to an impact on the NF-κB signaling pathway as a major pathway in inflammation, immunity, and cellular stress responses [17]. The associations of rs28362491 with over a dozen types of diseases, such as cancer, cardiovascular diseases, and autoimmune diseases, have been reported in studies [18, 19]. Given the functional potential of this variant and the multitude of associated diseases, this SNP was chosen to be a potentially representative and biologically relevant genetic marker for an investigation of contribution to susceptibility in the phenotyped population.
Assessment of glycemic profile
HbA1c (%) and FBG (mg/dl) parameters were assessed depending on kits instructions by spectrophotometric analysis. Fasting insulin (µu/ml) was assessed depending on ELIAS kit depending on kit protocol.
HOMA-IR was calculated depending on the formula includes fasting insulin (mU/L) multiplied by fasting glucose (mg/dl) then divided by 405.
Assessment of kidney markers
Blood Urea (UR) and Creatinine (CR) (mg/dl) parameters were assessed depending on kits instructions by spectrophotometric analysis.
Assessment of NFKB1 gene expression
The GoTaq 1-Step RT-qPCR System, which combines GoScrip Reverse Transcriptase and GoTaq qPCR Master Mix in a single-step real-time amplification reaction, is optimized for RT-qPCR and includes a proprietary fluorescent DNA binding dye called Sybr Green Dye. According to the GoTaq® 1-Step RT-qPCR component, total RNA, primers, and Nuclease-free water were all thawed on ice and each solution was thoroughly mixed. The RT-qPCR reactions were carried out using the cycling program displayed in Table 1 [20, 21].

Absolute and relative quantification are the two methods used to analyze qPCR results. The input gene amount is determined by absolute quantification using a standard curve developed by Livak and Schmittgen [22]. The relative quantification, on the other hand, assesses variations in gene expression in comparison to a reference gene sample. It is also possible to prevent standard curve creation errors brought on by standard dilutions. Furthermore, precise DNA/RNA molecular counts are not always as interesting as the relative gene abundance between two treatment groups. As a result, relative quantification is frequently used. The Pfaffl equation was used to determine gene expression, gene fold, or RQ (Relative Quantification) value:
RQ = 2-(ΔΔCT)
For each triplicated sample, the gene fold was first determined by obtaining the average CT (CT-cycle threshold) value using a real-time PC device. Next, the ΔCT value was computed for each sample in the manner described below.:
Δ CT = CT (gene of interest) – CT (reference gene)
The difference between the CT values of the reference gene and the gene of interest for a particular sample is known as ΔCT. Normalizing the gene of interest to a gene that is unaffected by the experiment is crucial.
The following is the result of calculating the ΔΔCT value:
ΔΔ CT = Δ CT (treated sample) – Δ CT (untreated sample (control))
After calculating ΔΔ CT for all samples, the final equation is taken to calculate the gene expression (fold change) as follows:
Fold gene expression RQ = 2-(ΔΔCT)
NFKB1 (rs28362491) SNP analysis
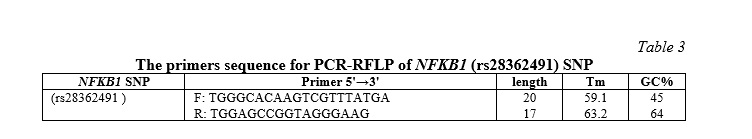
The NFKB1 (rs28362491) SNP was assessed by using the polymerase chain reaction technique known as restriction fragment length polymorphism (PCR-RFLP) with specified primer sequences, as indicated in Table 3.
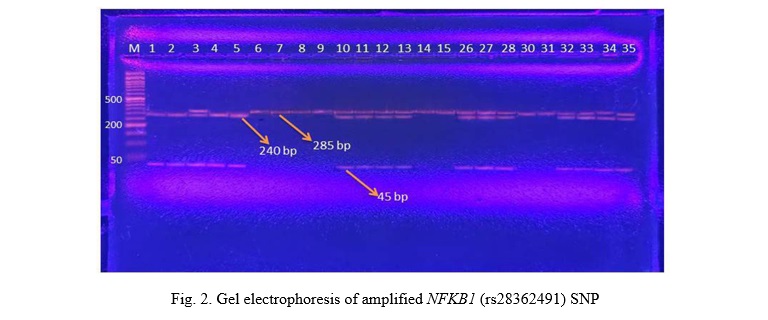
The PCR product was digested using one unit of the restriction enzyme PfIMI (10 U/μL) in order to identify two distinct alleles: the 45 bp and 240 (I allele) and the 285 bp (D allele). The PCR product-enzyme mixture was incubated for the entire night at 37 °C before being electrophoresed for 45 minutes at 90 V in a 2% agarose gel. Different lengths of heterozygous DI (3 bands: 285 & 240 & 45 bp), homozygous II (2 bands: 45 & 240 bp), and homozygous DD (1 band: 285 bp) were used to represent the three DNA fragments.
NFKB1 gene expression analysis
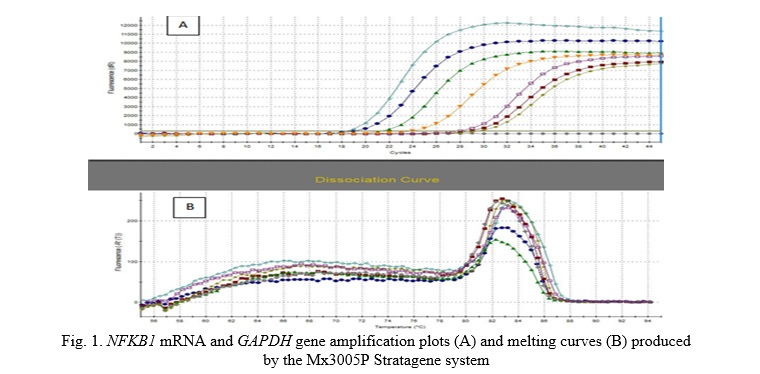
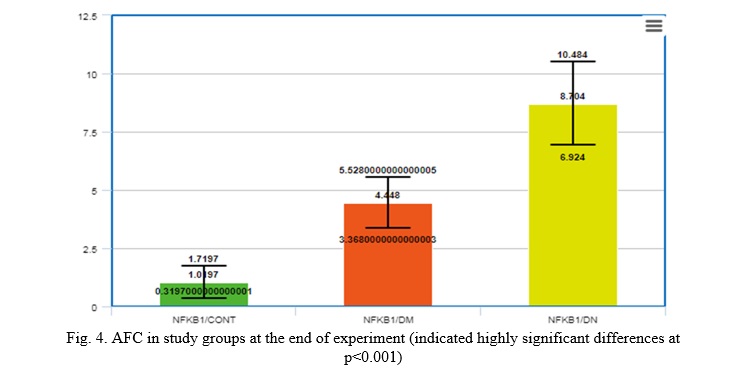
By using quantitative RT-PCR analysis and estimating the average fold change expression (AFC) of this gene's expression across all research groups, the current study examined the expression of NFKB1 mRNA. The results of the molecular analysis showed that the amplification plot values of the target gene, NFKB1 mRNA, and the house-keeping gene, GAPDH, varied significantly, as shown in Fig. 1.
Statistical Analysis
Statistical analysis will be conducted utilizing the Graphpad Prism for Windows statistical software, version 6.0. Data will be presented as means ± S.D. The impact of treatments will be statistically assessed using the one-way analysis of variance (one-way ANOVA) followed by Turkey's post-hoc test to adjust for multiple comparison treatments. Statistical significance will be established at the p<0.05 level.
Results
Biochemical analysis
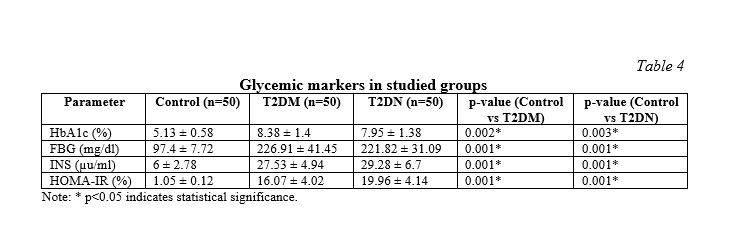
The HbA1c%, FBG (mg/dl), INS (µu/ml), and HOMA-IR% indices of glycemic control were significantly higher both in the T2DM and T2DN groups compared with controls, indicating poor glycemic control and insulin resistance in diabetes individuals, especially in the T2DN group with the highest levels of insulin as shown in Table 4.
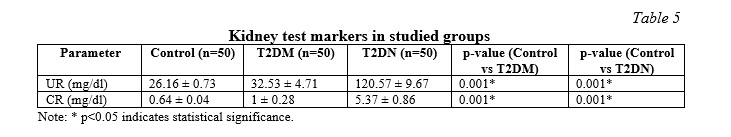
The results of present study shown no significant differences in blood urea and serum creatinine when T2DM patients with nephropathy were compared with the T2DM subjects without nephropathy (Table 5) compares to the control group. The Control group had UR levels of 26.16±0.73 mg/dl, while the T2DM group had 32.53±4.71 mg/dl and the T2DN group had 120.57±9.67 mg/dl. For CR, the Control group showed 0.64±0.04 mg/dl, the T2DM group had 1±0.28 mg/dl, and the T2DN group had 5.37±0.86 mg/dl. Both UR and CR levels were significantly higher in the T2DM and T2DN groups compared to the Control group (p<0.001). The T2DN group exhibited the highest levels of UR and CR, indicating more pronounced renal impairment in this group compared to the T2DM group.
NFKB1 (rs28362491) SNP analysis
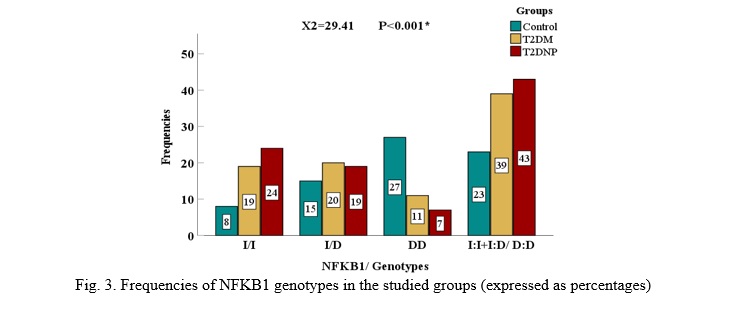
Figure 2 and Table 6 presents the genotype frequencies of the NFKB1 (rs28362491) gene polymorphism across the three groups: Control (N=50), (T2DM, N=50), and (T2DN, N=50). The analysis reveals significant differences in the distribution of genotypes and alleles among the groups.
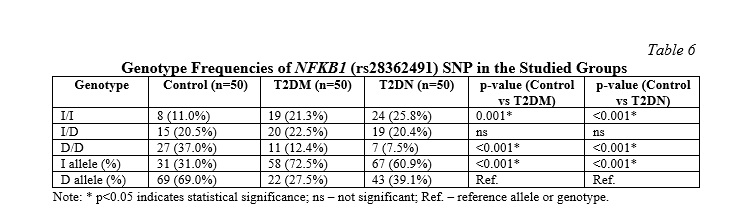
The I/I genotype was present in 11.0% of the Control group, 21.3% of the T2DM group, and 25.8% of the T2DNP group. The p-value for this genotype was <0.001, indicating significant differences in its distribution across the groups. This suggests that the I/I genotype is more prevalent in individuals with T2DM and T2DN compared to the control group. In contrast, the I/D genotype was found in 20.5% of the control group, 22.5% of the T2DM group, and 20.4% of the T2DN group. The p-value for this genotype did not indicate significant differences, suggesting that the I/D genotype is similarly distributed across all three groups. The D/D genotype was present in 37.0% of the control group, 12.4% of the T2DM group, and 7.5% of the T2DNP group. The p-value for this genotype was <0.001, showing significant differences. This indicates that the D/D genotype is more common in the control group compared to the T2DM and T2DN groups.
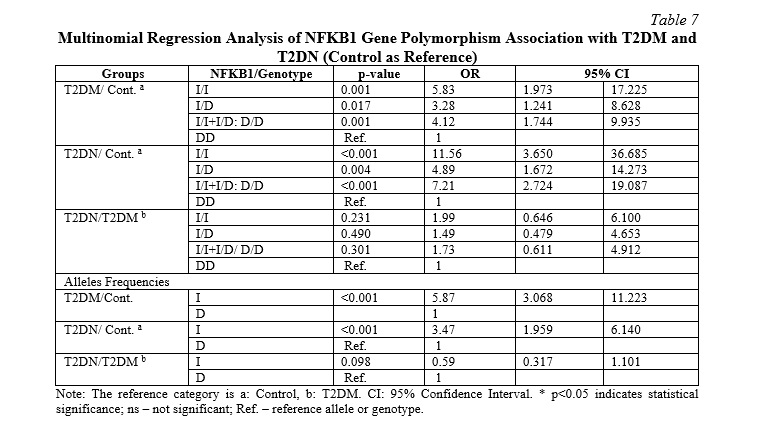
In terms of allele frequencies, the I allele was significantly more frequent in the T2DM group compared to the control group, with an OR of 5.868 (95% CI: 3.068-11.223) and a p-value of <0.001 (Table 7). Similarly, the I allele was significantly more frequent in the T2DN group compared to the control group, with an OR of 3.468 (95% CI: 1.959-6.140) and a p-value of <0.001. However, there was no significant difference in the frequency of the I allele between the T2DN and T2DM groups, with a p-value of 0.098.
Chi-square test for I/I, I/D, D/D comparison used 2 degrees of freedom. Grouped genotype comparisons (I/I + I/D vs. D/D) used 1 degree of freedom (Fig. 3).
NFKB1 gene expression analysis
The results of the current study suggested that there is a significant difference (P<0.001) in Average Fold Change (AFC) between (NFKB1/CONT) group (1.0197±0.7) (NFKB1,T2DM)(4.448±1.08, and (NFKB1,T2DDN)(8.704±2.14 ), respectively, as shown in Figure 4.
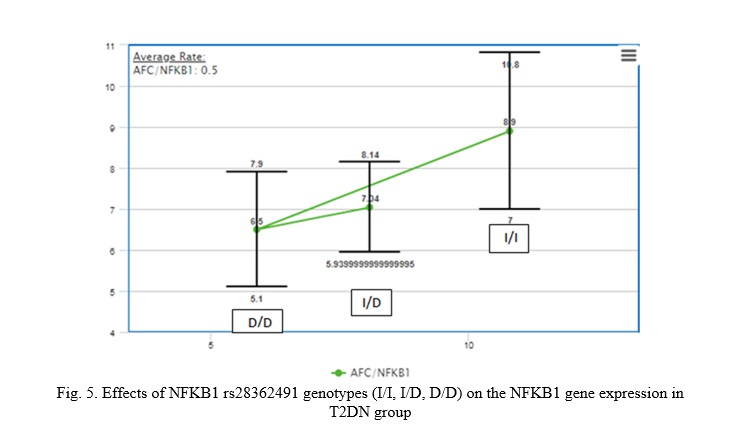
The results shown the effects of NFKB1 rs28362491 genotypes (I/I, I/D, D/D) on NFKB1 gene expression in T2DN group. This study shown significant statistical differences (p-value<0.05) between I/I and I/D genotypes and between D/D compare to I/D genotypes, and this indicate that patients with I/I NFKB1 rs28362491 genotypes has more risk factor for increase of the AFC of NFKB1gene expression, as shown in Figure 5.
Discussion. This study indicates the potential mechanistic link between NFKB1 gene expression and dysregulated glycemic control, indicating that chronic hyperglycaemia may be an upstream inducer of NF-κB signalling. The NFKB1 increase in T2DN patients is very high which corroborates the idea that the hyperglycemia-induced oxidative stress and inflammation worsen renal injury via transcriptional NFKB1 upregulation. These results are in line with previous data related to increased renal NF-κB activity in the diabetic situation, where it leads to nephron inflammation and fibrosis. The rs28362491 polymorphism in the promoter region of NFKB1 is particularly intriguing, as it appears to modulate gene transcription. While this investigation demonstrates a strong correlation between the I/I genotype and increased NFKB1 expression in T2DN cases, there is a notable lack of power to generalize the utility of interpopulation genotype comparisons. However, based on the high expression profile in subjects with the I/I genotype, a biological effect of this polymorphism is indicated that may increase promoter activity, resulting in an increase in inflammatory responses.
One of the main causes of morbidity and death among diabetic patients, diabetic nephropathy (T2DN), has a significant negative impact on both health and the economy [23]. The prevalence of diabetic nephropathy in DM patients has not been thoroughly studied, despite the fact that the number of people with DM in Iraq is rising [24]. Thus, the purpose of this study was to determine the prevalence and determinants of DN in T2DM patients from Iraq. The study investigates the metabolic profiles of individuals with T2DM and T2DN compared to a healthy control group, focusing on key parameters such as glycemic profile including the fasting insulin, fasting blood glucose levels and HOMA-IR. From a researcher's perspective, these findings point out insulin resistance as the fulcrum upon which the development of diabetes mellitus and its complications revolves. The higher HOMA-IR% in the T2DN group probably points to insulin resistance being causative of nephropathy, hence justifies further research in specific therapies that will enhance insulin sensitivity [25].
In one such study designed to explore the association of NFKB1 expression and polymorphism and IL-17A polymorphism in diabetic mellitus with or without renal disease, the levels of HbA1c%, FBG, INS, and HOMA-IR% were found to be significantly higher in both T2DM and T2DNP groups than that in the control group. Among diabetic patients, those with nephropathy presented higher inflammatory markers (e.g., IL-7, NF-κB), which play an important role in the pathogenesis of diabetic nephropathy [26]. The results underline the interaction between genetic predisposition, inflammation, and metabolic parameters that occurs in the development of diabetes and its complications [27].
Growth factors and cytokines are among the numerous genes whose expression is regulated by the transcription factor nuclear factor kappa B (NF-κB). Consequently, NF-κB is essential for many biological functions, and pathogenic processes would result from its dysregulation [28]. Because they regulate the expression of several pro-inflammatory genes, NF-κB and its inhibitors may play a major role in the pathophysiology of type 2 diabetes, diabetic nephropathy, diabetic retinopathy, and diabetic cardiomyopathy [29]. According to Ziyadh et al., this study is valid with a p-value of less than 0.05. The groups with diabetes mellitus and diabetic nephropathy had significantly greater FBG, PPBG, and HBA1C than the control group. lipid profile for each of the three groups [30].
The frequencies of NFKB1 gene polymorphisms are displayed in Table 6. In the control, T2DM, and diabetic nephropathy groups, the insertion/insertion polymorphism rates are 11%, 12.4%, and 25.8%, respectively. In the control, T2DM, and T2DN groups, the deletion/deletion polymorphisms are 37%, 12.4%, and 7.5%, respectively. In the control, type 2 DM, and diabetic nephropathy groups, the insertion/deletion polymorphisms are 2.5%, 22.5%, and 20.4%, respectively. The relationship between oxidative stress and inflammation biomarkers and the risk of chronic kidney disease in people with Type 2 diabetes mellitus in the North Indian population was investigated by Gautam, A. et al. [31]. Using the PCR-RFLP technique, Senol Tuncay et al. (2012) investigated the detection of NFkappaB1 and NF-kappaBI Alpha polymorphisms in a Turkish population [32]. However, in genotype and allele frequencies, no significant differences between T2DNP and T2DM were detected; thus, the NFKB1 polymorphism cannot differentiate both diabetic conditions. Therefore, it is speculated that, although the NFKB1 polymorphisms increase the risk of developing diabetes with its complications, they are not specifically responsible for the transition from T2DM to T2DN. This might indicate to researchers that other genetic, environmental, or metabolic factors could play a more critical role in progression to nephropathy and hence, are worth further investigation.
Several studies have established clear correlations between NFKB1 gene expression and glycemic parameters in diabetic conditions. Darwish et al. found a marked positive correlation between NFKB1 gene expression and both fasting blood glucose (FBG) and glycated hemoglobin (HbA1c) in type 2 diabetes (T2D) patients without nephropathy. Additionally, in patients with diabetic nephropathy (DN), HbA1c showed positive correlations with all profibrotic genes, including NFKB1 [33]. These findings suggest that chronic hyperglycemia, as reflected by HbA1c levels, may drive NFKB1 upregulation, particularly in patients with nephropathy.
Accompanied by current results, Mohamed et al. (2023) have reported that NF-κB1 D/D genotyping frequency was higher in the control group than T2DM without nephropathy and T2DM with nephropathy, accounting for 76% > 38% > 27%, respectively, while for NFkβ1 I/I genotyping, it was higher among T2DM with nephropathy than T2DM without nephropathy than the control group, accounting for 70% and 49% > 24%, respectively [34]. They also stated that regarding NF-κB1 alleles, the frequency of the (Deletion) allele was higher in the control group compared to T2DM without nephropathy and T2DM with nephropathy, while the (Insertion) allele took the opposite pattern among the studied groups. This is also agreed with Behera et al. (2020) in the East Indian population. Our study agreed with some findings and disagreed in others with the research of Gautam et al. (2017), who found in control and T2DM people without nephropathy, that the frequency distribution of I/D was the highest followed by I/I, with the least frequency distribution of D/D in the same subjects. The results listed in Table 7, the individuals with diabetes who have the ins/ins NFKB1 gene polymorphism are 3.4 times more likely to develop diabetic nephropathy. According to Gautam et al. (2017) individuals with diabetes mellitus who have the ins/del polymorphism have a 1.90 fold increased chance of developing nephropathy, and patients with type 2 diabetes who have the ins/ins genotype similarly have a higher risk [35]. Patients with diabetes who have a deletion/deletion NFKB1 gene polymorphism are 1.03 times more likely to develop diabetic nephropathy. Beyond direct glucose parameters, NFKB1 expression has been linked with inflammatory markers in diabetes. Increased expressions of interleukin (IL)-1β and NFKB1, along with enhanced macrophage infiltration, have been observed in pancreatic islets of T2DM patients. Patients with diabetes who have an insertion/deletion polymorphism in the NFKB1 gene are 0.6 times more likely to develop diabetic nephropathy. The favorable link between I/D NFKB1 (rs28362491) SNP and other glycemic markers, along with the higher levels of NFKB1 gene expression fold, suggest that these markers may be crucial for the early diagnosis of T2DN. These results also demonstrate that these indications are more diagnostically valuable than microalbuminuria in the early detection of T2DN [36, 37, 38].
Conclusion. According to the current study's findings, patients with diabetes who have the NFKB1 I/D SNP are more likely to develop nephropathy (T2DN). This SNP can be regarded as a genetic marker for T2DM patients' propensity to develop nephropathy. Consequently, more analysis with a large sample size is required to search for the potential of these polymorphisms as genetic markers in the near future. This would make it easier to find type 2 diabetic patients who could be more susceptible to nephropathy.
Financial support
No financial support has been provided for this work.


Reference lists